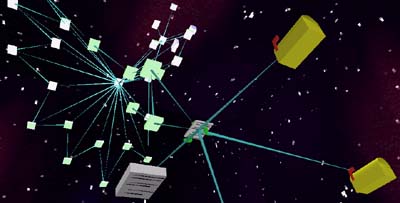
The statistical information obtained by MINT is related to a complex hypermedia document. It is essential to offer a way to understanding this graph for optimization and analysis purpose. The proposal contains a graph-based visualization tool that shows frequently used areas (pages) and the path through the system.
Historical Context: Web Analytics in 1997
In 1997, web analytics was a nascent field. The tools commonly available at the time were basic server log analyzers like Analog, WebTrends, and AWStats that tracked simple metrics such as page views, referrers, and browser types.
The "graph-based visualization" mentioned was an advanced concept for its time. What MINT proposed—tracking user paths through a complex hypermedia system—presaged modern heat mapping, user journey analysis, and behavior flow visualization that wouldn't become mainstream for another decade.
The original page contained a link to a VRML (Virtual Reality Modeling Language) 3D visualization that would have shown interactive navigation paths through the system. This was cutting-edge technology for visualizing complex data in 1997.
This section is in development as part of the digital archaeology restoration project.
The complete content for Statistical Information will be expanded in a future update, potentially including a modern visualization tool to replace the original VRML model.